protein ligand docking     molecular modeling and computational chemistry  
  high throughput screening     Enrichment curve and enrichment factor  
 

Lead–Finder


protein structure preparation


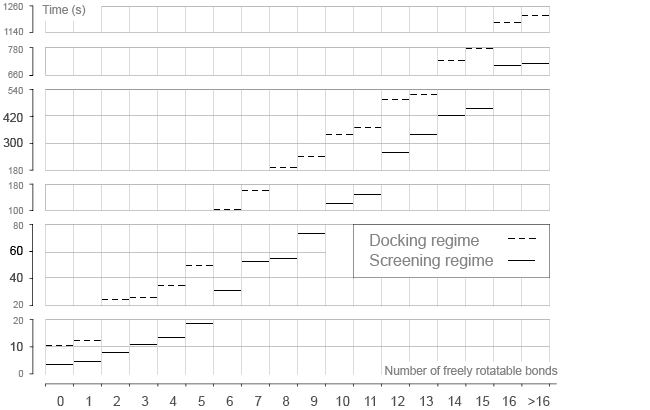
Dependence of speed of docking calculations on the number of ligand’s freely rotatable bonds for two regimes (default docking and screening). Each mark represents average time over compounds (from the docking success rate benchmarking set of 407 complexes) with certain number of freely rotatable bonds.

protein ligand docking
   

Speed of calculations

Free energy of ligand binding.

Speed of ligand docking calculations depends on the settings of genetic algorithm search. Currently two types of settings are predefined in Lead-Finder: more accurate and exhaustive search in the default docking regime and faster search in the screening regime. While default docking settings were adjusted to yield maximum docking accuracy, settings for the screening regime were ´lightened‘ to achieve maximum speed of calculations at the cost of small (~5%) decrease in Docking Success Rate.

To benchmark speed of docking calculations a set of 407 diverse protein-ligand complexes (used also for Docking Success Rate measurements) was used. All calculations were performed in two regimes: default docking and screening. Results of current benchmarking studies providing average time needed to dock ligand with a certain degrees of freedom (number of freely rotatable bonds) are presented on the figure. As can be seen from the figure, screening regime performs 2–4 times faster than default docking, taking on average 30 seconds for docking ligand with 6 freely rotatable bonds.

Текст


Time expenditures to screen library of 300 000 compounds against different protein targets on 16-node (dual Xeon 5150 2.6 GHz) computer cluster.

protein ligand docking
   

Protein target

Time pre liganda, seconds

Total screening timeb, hours

Volume of the energy gridc, Å3

Monoamine oxydase A

9.00

7.50

4300

HIV-1 reverse transcriptase

10.4

8.70

5580

Thyroid hormone receptor beta1

10.6

9.19<

6200

Monoamine oxydase B

11.0

8.87

6720

Vitamin D receptor

13.4

11.18

8350

Dihydroorotate dehydrogenase

14.7

12.24

9730

Dihydrofolate reductase

15.0

12.48

9400

HMG-CoA reductase

15.2

12.67

9390

Leukotriene A4 hydrolase

15.8

13.16

9480

PPAR-γ

18.4

15.36

14670


a) Time pre ligand indicates average time (in seconds) of docking one compound from the library (on the single processor core).
b) Total screening time  total time (in hours) of virtual library screening on the computer cluster.
c) Volume of the energy grid  indicates the volume of the energy grid (for more details on grid definition see section Technology).


Speed of ligand docking was also benchmarked by us in a number of real-life virtual screening studies, in which commercial library of 300000 compounds (STK library by Vitas-M Laboratory) was screened against a number of protein targets. Using a cluster of 16 computational nodes (dual Xeon 5150 2.6 GHz) we were able to screen the whole library in 12-24 hours depending on the protein target. Average time for docking on compound from the library for particular protein is provided in table above.

Текст


Relative speed of ligand docking calculations using different computer platforms.

protein ligand docking
   

To extrapolate speed of docking calculations for other machine architectures, the following table can be used:

OS

Platform

CPU

Relative speed

Windows

x86_32

Xeon 5150 2.67GHz

1.7

Linux

x86_64

Core2Duo 2.4GHz

1.8

Linux

x86_64

Opteron 246 2GHz

1.0

Linux

x86_32

Athlon MP 1.67GHz

0.4

Текст


  Drug design     Drug discovery